From a point01
PointPanorama, Sep 17
 RateLab
· Rate Shopper 2.0 & Revenue Workspace
Compare your market position and current rates, track changes over time, discuss specific dates, and turn insights into clear tasks — all in one workspace.
Quick start with no setup14-day free trialRates and competitors in one view
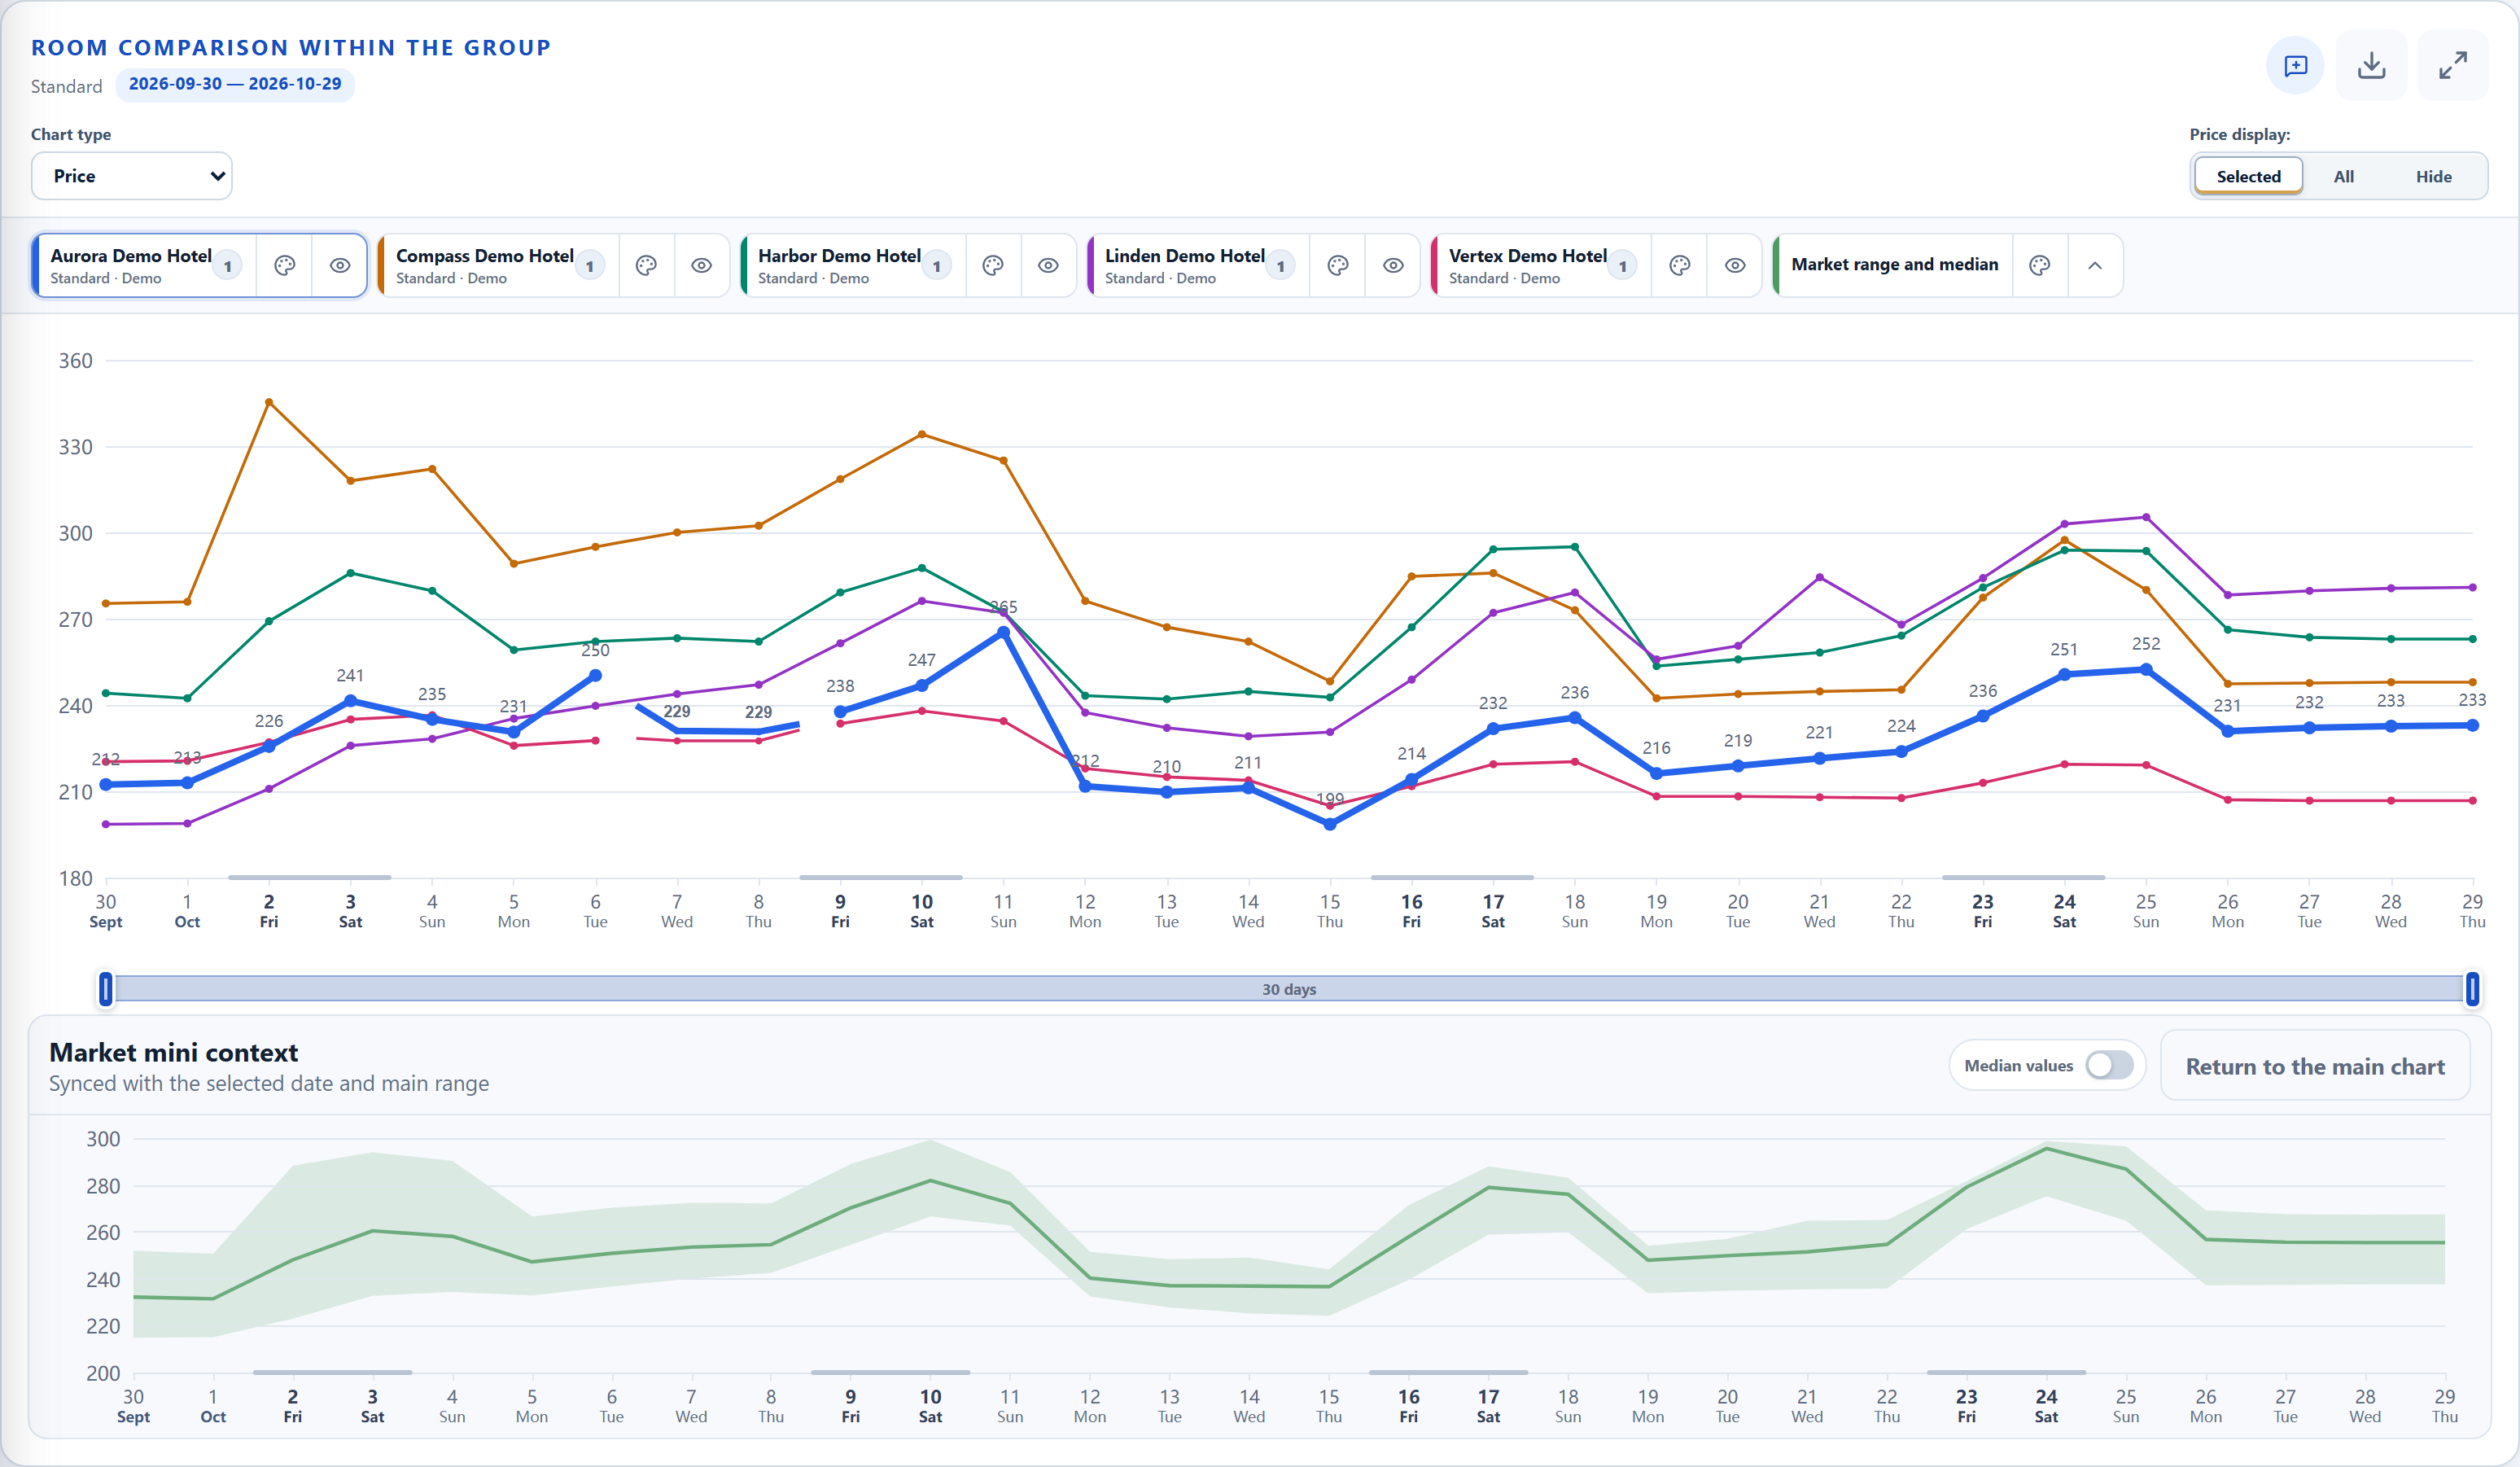
Rates, availability, position, median, and date range for your property and competitors.
Market dataShared contextDiscussionTask
· market fingerprints
Analyse when and how competitors changed their rates. We keep a history of changes so you can see not only their current rates but also understand when and how the market changed. Track rate increases and decreases, changes in availability, and the sequence of competitors’ actions. This helps you spot market signals sooner, analyse how your competitive set responds to demand, and make more informed decisions about your own rates.
| Check-in date | Before | After | Change |
|---|---|---|---|
| Thu, Sep 10 | 4,398 | 4,338 | −60 · −1.4% |
| Fri, Sep 11 | 4,330 | 4,290 | −40 · −0.9% |
| Sat, Sep 12 | 4,445 | 4,415 | −30 · −0.7% |
| Mon, Sep 14 | 4,408 | 4,448 | +40 · +0.9% |
| Wed, Sep 16 | 4,300 | 4,385 | +85 · +2.0% |
| Thu, Sep 17 | 4,350 | 4,460 | +110 · +2.5% |
| Fri, Sep 18 | 4,415 | 4,495 | +80 · +1.8% |
| Sun, Sep 20 | 4,708 | 4,653 | −55 · −1.2% |
| Wed, Sep 23 | 4,455 | 4,405 | −50 · −1.1% |
Holiday peakCompetitor A
Oct 9–10: +997 · +13.9%
Pricier weekendsCompetitor B
weekdays +4.9%, Fri–Sat +5.2%
One price for all datesCompetitor C
weekdays +20.0%, Fri–Sat −6.9% → 3,888
Cut on all datesCompetitor D
29 dates: −138 to −455
· analysis, discussion, task
Explore the situation on your own, involve your colleagues or create a task straight away. There’s no fixed workflow: use each tool on its own, or move between them as needed.
Price chart for Aurora Demo Hotel and competitors, September 10–24: group median and market range. The date range September 16–18, Wed–Fri, 3 days, is selected.
Aurora Demo HotelGroup medianMarket range
The Discussions window: Oleg sent the September 16–18 range as a chip and asked whether to check the terms; Maria replied that she would check the comparison.
The Tasks page: the task “Check the rate for September 16–18” is open — in progress, high priority, assigned to Maria, due September 14.
A discussion starts from whatever you are looking at
· depth of analysis
RateLab lets you vary the depth of analysis: get a quick overview of the market and examine dates that need attention in detail. The context stays with you throughout — from the market overview to the history of changes and the decision you make.
QUICK VIEW
Quick view lets you assess the entire sales horizon and quickly identify dates and periods that need closer attention — without opening each date in sequence or examining every competitor in detail.
DEEP ANALYSIS
When a particular date needs an explanation, you can explore the same context in successive layers: from the market's current state to the history of changes, the sequence of competitors' actions, additional data views, discussion, and next steps.
· ROLES AND TASKS
RateLab reduces manual monitoring and helps teams focus on decisions — from market and rate analysis to coordinated team action.
A quick start without PMS integrations, complex setup or additional workload for the team.
· product boundary
We are convinced that a product delivers real value only when it is easy to use. For us, ease of use means speed and efficiency in everyday work. That is why user experience remains one of RateLab’s top priorities.
Automatic collection of competitor prices is already joined with the working context of the team. And this integration continues.
Display dates and segments worth checking, configure conditions and receive notifications for a timely response. Assess relative to competitors, the competitive group average, the median, a price corridor or a combination.
AI works not as a separate chat but inside the team conversation that is already there, and inside its evidence.
Extracts the working goal from the managers’ conversation and, after human confirmation, creates a structured task for subsequent automated execution.
A unique export system with a report builder designed for different scenarios
Direction of development
Speed up, automate and simplify the entire chain of processes for hotel teams — from detecting a significant change to coordinated action and subsequent review, while keeping people in control of decisions.
Pricing
Try RateLab on your property.
14 days · no card
Daily analytics for your properties.
$35.00 per month for all properties
All your properties in one workspace.
$100.00 per month for all properties
Your own way to partner with RateLab.
Individual pricing
· getting started
All you need to get started is the hotel name and a list of competitors to compare.
A clear interface: from comparing prices to discussing them with your team.
Help with setup and guidance as you take your first steps.
Answers to frequently asked questions
If your question is not answered here, you can ask it during onboarding — before any commitment.
No. Onboarding requires no setup on your side and does not use your data.
No. The product helps you collect, analyse, discuss and assign tasks. The decision and the execution stay with people.
It is a specialised environment with integrated context. Messages and tasks are anchored to the property, the dates, the chart and the source data — they do not live apart from the analysis.
Yes. A quick view of the current situation is a complete way to get a regular picture of the market; the app opens the detail when you need it.
Free and Basic include five per property, Pro includes ten. You can add more.
In this case, a missing price is shown as a missing observation, for example when sales for that room are closed. All information about data quality and possible limitations is available in the app.
RateLab · today
No card or payment information required.